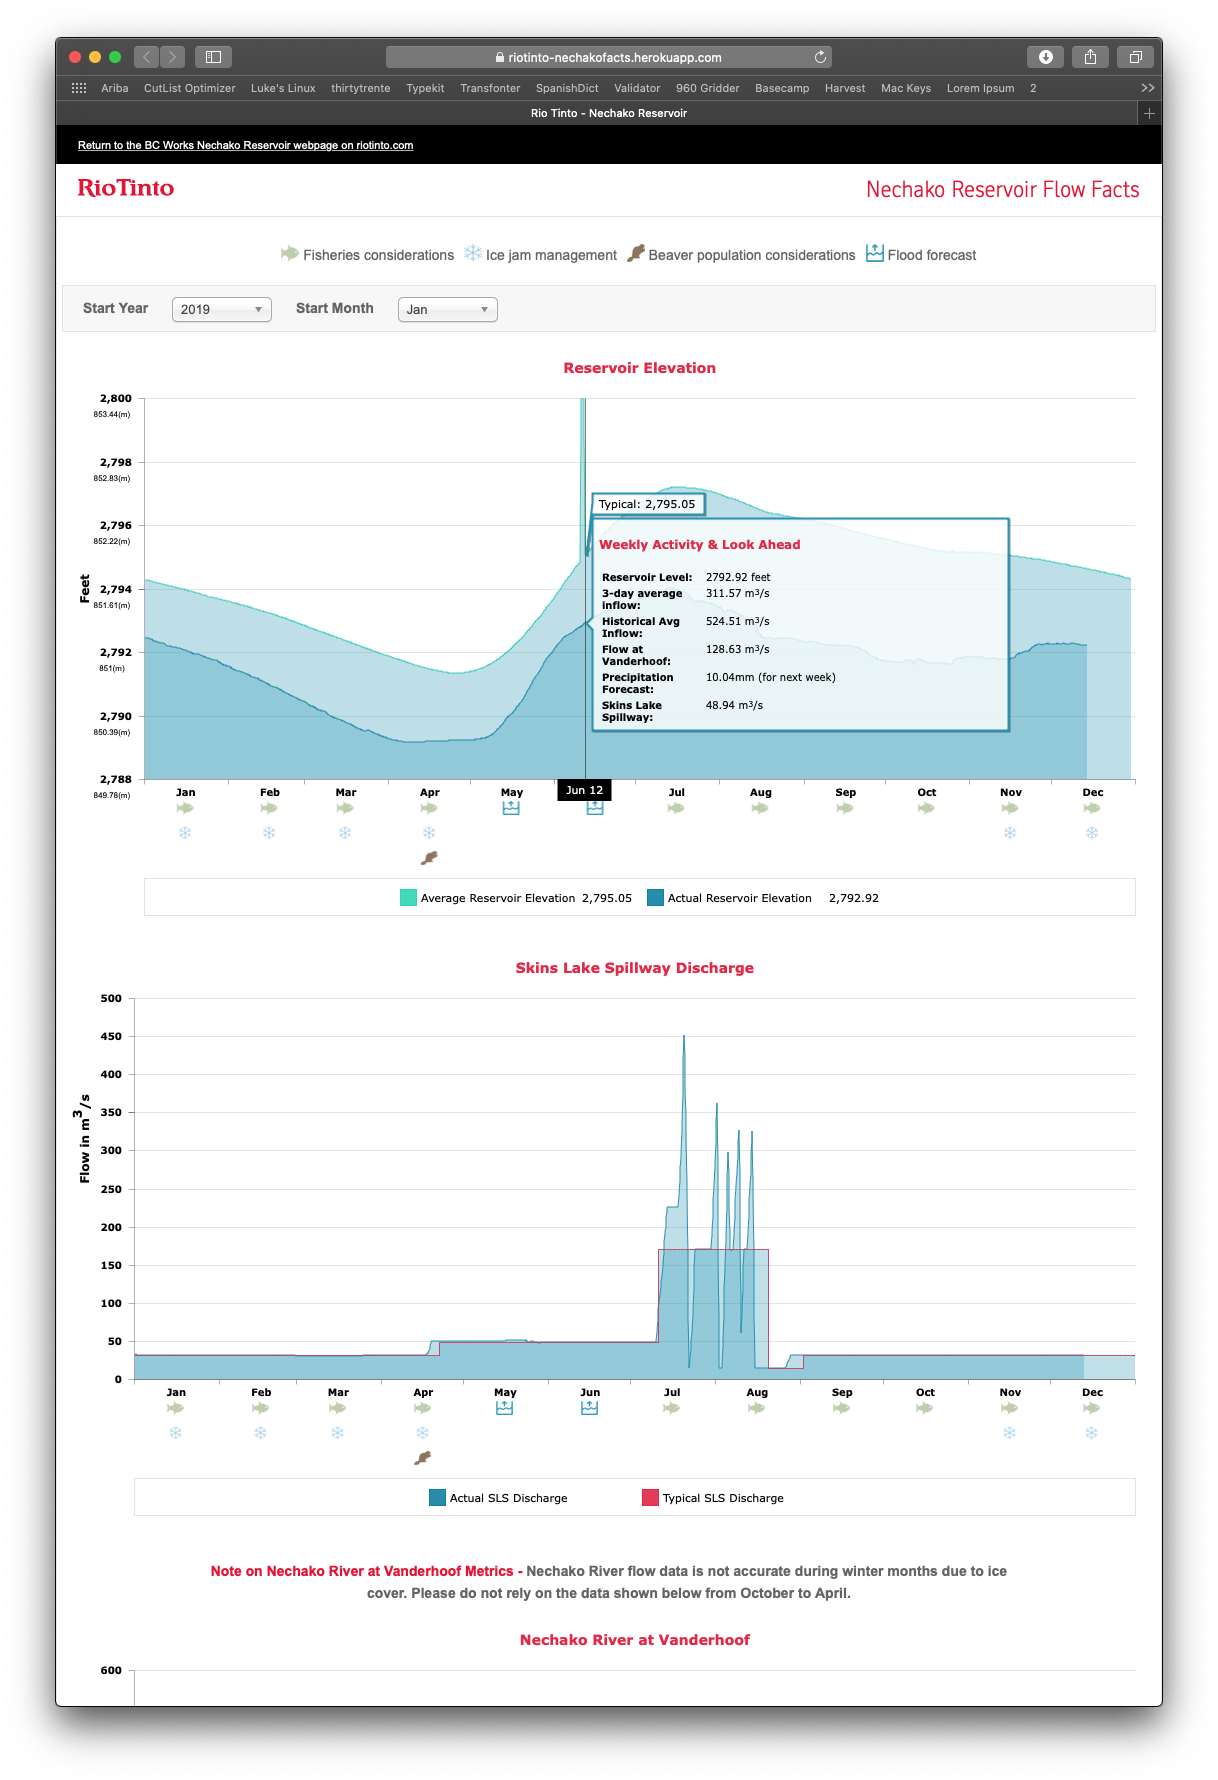
Project Summary: UI/UX Design and Development of live-data waterlevel and flow charts for Rio Tinto
Technologies: HTML5, CSS, JavaScript, jQuery, Rails, PostgreSQL
Client: RioTinto
Year: 2016
RioTinto monitors and reports on river and reservoir levels around their operations in Nechako region of British Columbia. They required live data charts to represent current and historical charts in weekly reports to stakeholders and nearby community.

